Identifying sales patterns
See which pipeline is more active and produces more deals. Inperium Sell helps you identify sales patterns and improve your workflows.
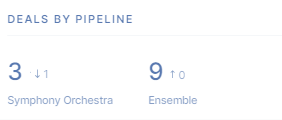
On the Dashboard, you’ll find the Deals by pipeline widget. It shows how many deals you have in each pipeline overall and in comparison to a previous time period.
Interpreting results
Besides seeing statistics as it is, this widget is a valuable source of information about your sales patterns and workflows.
For example, you may notice that you have significantly more deals in one pipeline than in the others.
- It can be related to sales and marketing strategies — e.g., you target your services at B2B clients while keeping B2C sales relatively low.
- Or this disproportion can be a result of your personal expertise or preferences — e.g., you are highly skilled in engaging new customers so you don’t really process deals within the Maintenance pipeline.
Setting time periods
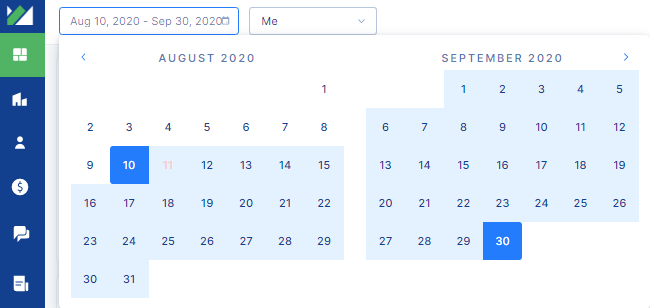
Inperium helps you compare your current statistics to a previous time period. For example, when you select August 10 to September 30 (52 days) as a reporting time period, Inperium will use the previous 52 days (June 19 - August 9) as a reference time period.
Deals leaderboard for managers
Managers have an option to switch to team statistics and see the total deals count.