Monitoring activity
Learn how proactive you are and estimate how much effort it takes to achieve your sales goals. Inperium Sell provides you with statistics on activities: tasks, emails, calls, and meetings.
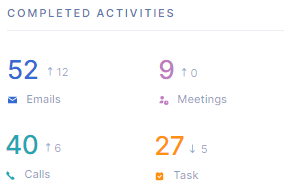
On the Dashboard, you’ll find the Completed activities widget. Here you’ll see a high-level overview of your actions - emails you wrote, tasks you created, meetings and calls you logged when working with companies, contacts, and deals.
Interpreting results
For each category, you’ll find the number of items as well as a hint showing you if you accomplished more or less compared to a previous time period. The upcoming trends tell you that you added more actions while downward warns that you might be missing in productivity and have to catch up.
Productivity tip
Try matching activity statistics with Deals revenue and Deals outcomes. Over time, you’ll be able to calculate how much effort it takes to win a deal. For example, you might notice that months, when you schedule more customer meetings, have higher rates of successful deal closures. The chances are that your clients enjoy personal meetings and are more willing to sign up for your services. Leverage this data to adjust your sales pipeline and strategies.
Setting time periods
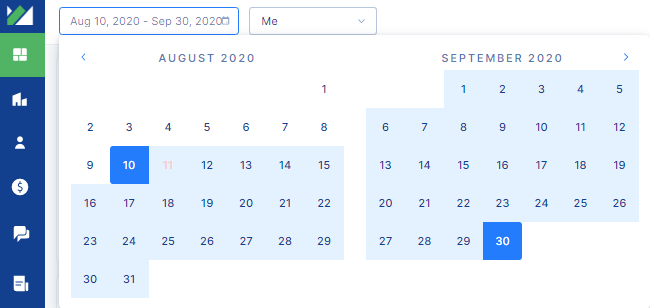
Inperium helps you compare your current statistics to a previous time period. For example, when you select August 10 to September 30 (52 days) as a reporting time period, Inperium will use the previous 52 days (June 19 - August 9) as a reference time period.
Activity leaderboard for managers
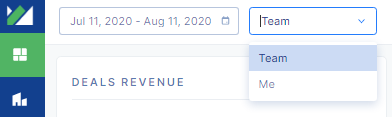
Managers have an option to switch to team statistics and see the total activity count. On top of that, the managers have access to the Activity leaderboard.