Productivity dashboard
The dashboard is the first thing you see as you log in to Inperium Sell. It helps assess team or personal productivity and track progress.
The dashboard is a great source of information. Depending on your role in Inperium, you’ll be able to see either personal statistics or aggregated data for the entire team. Here you’ll find all the necessary sales metrics such as the number of processed deals, new leads, activity charts. Review widgets and adjust your sales procedures to ensure perpetual growth.
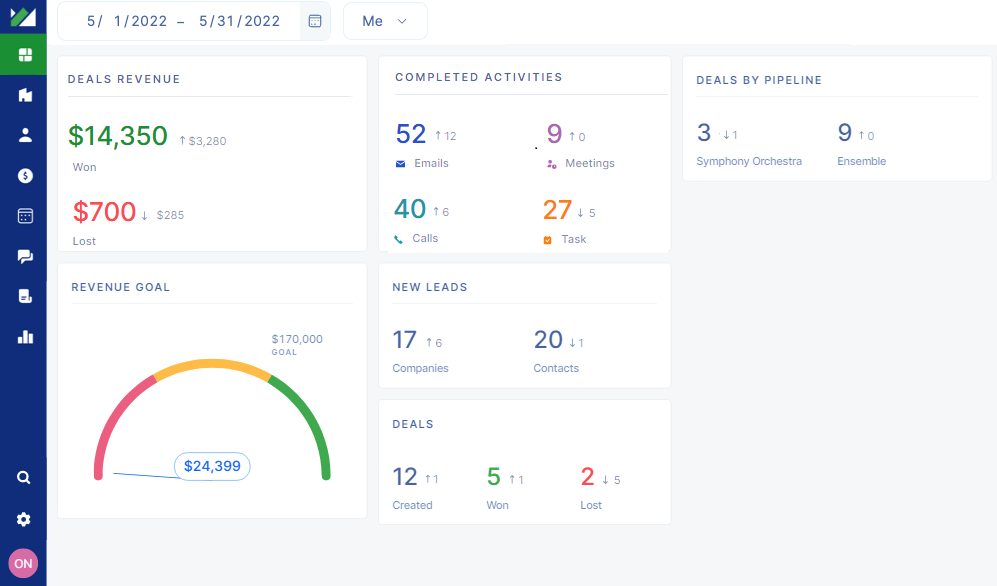
Each widget gives you specific information that you can further interpret according to your company’s specific situation and make forecasts, plan the workload, and optimize performance. Besides reviewing current values, in most cases, you’ll be able to compare them to those logged in a previous time period. If the values are smaller than they were, you’ll see a downward trend. If they are rising, then you’ll see the upward trend. Use these numbers to measure productivity and overall progress.