Tracking current revenue
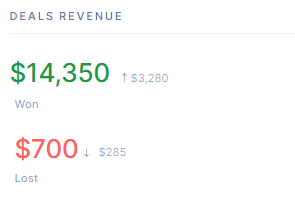
On the Dashboard, check out the Deals revenue widget to find out the total amount you earned by winning deals.
Tracking current revenue is important if you want to see how good you’re doing overall and in comparison to a previous time period. Find out how much worth the won deals are in total and how much you lost.
In this example, the arrow pointing up next to Won deals total notifies you that the sales grew. The downward trend next to Lost deals, informs that the lost revenue decreased compared to a previous period.
Setting time periods
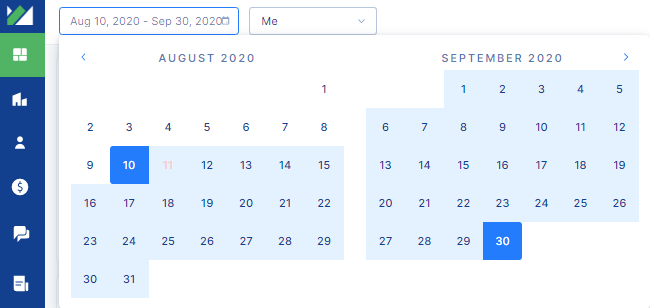
Inperium helps you compare your current statistics to a previous time period. For example, when you select August 10 to September 30 (52 days) as a reporting time period, Inperium will use the previous 52 days (June 19 - August 9) as a reference time period.
Total revenue
Managers have an option to switch to team statistics and see the total deal revenue.
Interpreting your data
- The trend for Won deals goes up. It means that the business got more profit. Keep going! Try identifying periods when the revenue goes up and analyze what typically precedes winning a deal.
- The trend for Won deals goes down. It means that the time period you selected hasn’t been as successful as a previous one. Review your lows and highs and consider external factors, such as holiday season or summer sales.
- The trend for the Lost deal goes up. Unfortunately, it means that more deals were qualified as unsuccessful or unresolved. It doesn’t necessarily mean that the business is no longer profitable. Consider ways to boost your sales process and service.
- The trend for the Lost deals goes down. It means that fewer deals are set to Lost and their total lost revenue is smaller. This is actually a good sign that your sales process is on the right track.
- The trends don’t change. It means that you’re pretty stable. Take a closer look — is there is room to grow? With Inperium you can take your growth from acceptable to exceptional!


